Royalty Analytics
Understand your catalog, anywhere it plays.
Distrofy publishes clean breakdowns of your streams, DSP consumption, and listener territories from imported royalty data — so you can make smarter catalog decisions.
Aggregated consumption data




Clear performance graphs.
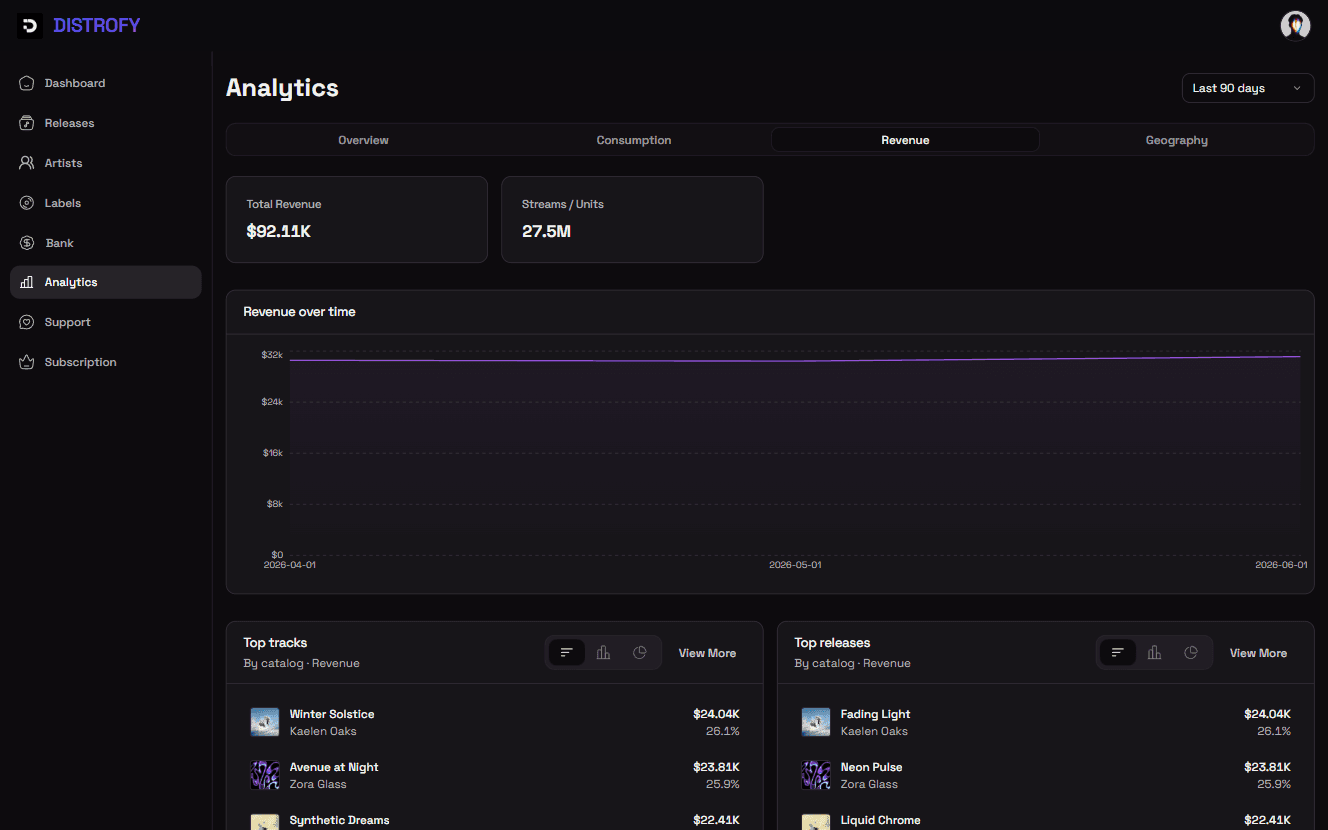
Track revenue and consumption trends from the royalty data Distrofy publishes to your account. See how your catalog moves over time without waiting on opaque third-party portals.
- 01
Revenue and stream trends in one view
- 02
Visual charts for recent periods
- 03
Track and release performance diagnostics
 Analytics
Revenue
$8,420.15
+18% vs prior
Streams
2.4M
+12% vs prior
Insights without the spreadsheet mess.
Period trends
See revenue and stream movement across the periods Distrofy publishes to your account.
DSP breakdowns
Compare Spotify, Apple Music, YouTube, TikTok, and other stores side by side.
Territory insights
Rank top countries and regions so you know where your catalog already performs.
CSV export
Export rankings and consumption breakdowns for managers, labels, or accounting.





Decisions backed by published royalty data.
Distrofy analytics reflects what we import and publish — so managers and artists plan releases from the same numbers that land in Distrofy Bank.
Drill down by store.
See exactly where your streams and revenue are originating. Compare performance side-by-side across Spotify, YouTube, Apple Music, and other DSP platforms.
- 01
Store-by-store performance analysis
- 02
Income and stream contribution metrics
- 03
Unified accounting reports per platform
Analytics


Locate your audience.
Identify your top listener countries and regions from published consumption data. Use territory insights to plan promotions where your catalog already performs.
- 01
World map of territory performance
- 02
Top countries ranked by streams or revenue
- 03
Territory filters alongside DSP and catalog views
AnalyticsTop markets by stream share
Export and share.
Keep your team aligned with rankings you can view in Analytics and export as CSV for accounting, managers, or label reviews.
- 01
CSV export from Analytics explore tools
- 02
Top tracks and releases rankings you can share
- 03
Transparent breakdowns by catalog dimension
Top releases
Nurul Hidayah
Rayan Noor · Single · 820K
$2,841

Sabilus Salam
Idris Alavi · Single · 540K
$1,987

Rahmatan Lil Alamin
Yusuf Hamdan · Single · 410K
$1,622

Subhanaka
Rayan Noor · Single · 290K
$1,154
Frequently asked questions
Explore
Jump to another part of the Distrofy stack.
Take control of your music data.
Signup for a Distrofy account to access granular streaming metrics and royalty tracking.